Case snapshot
Problem
Existing weather and allergy apps lacked detailed, hyperlocal pollen data, making it difficult for users to identify their specific allergy triggers.
Solution
Designed AllerTrack, an all-in-one allergy companion combining hyperlocal pollen, weather, and air-quality insights to help users understand their triggers and plan their day with confidence.
Role
As Product Designer, I owned the UX strategy, information architecture, user flows, and visual design from concept to launch.
Outcome
1K+ downloads on Android, with hyperlocal pollen forecasts, personalized alerts, symptom tracking, and allergy-focused insights. Innovation with constraints.
Project overview
1 month
for 1st launch. Ongoing project with additional feature releases.
What are we trying to solve
Allergies strike seasonally with invisible culprits like pollen, which varies dramatically even within 5km. Users battle sneezing, itchy eyes, and fatigue without context or tools to plan ahead. Existing apps bury pollen data in dense numbers, lacking personalization or habit-forming engagement.
What the product wanted to achieve
01
Track real-time pollen and 5-day forecasts in digestible formats.
02
Build habit loops via symptom logging and reports pinpointing allergy causes.
03
Enable proactive planning: daily predictions, travel routes, and medication reminders.
The speedbreakers on our path
01
Crunched timeline demanded rapid iteration and launch in pollen season.
02
Developers favored reusable library components; I prioritized "non-negotiable" design innovations (e.g., interactive visualizations) while deprioritizing generic features.
03
To manage the overload of information (Successfully overcame by evolving IA accordingly)
Research & key insights
Analyzed top global weather apps from a user perspective - what works (simple forecasts) and what fails (context-free data). Conducted user interviews with allergy sufferers to uncover pain points.
Pollen data lacks context
Pair numbers with plain-language health impacts (e.g., "Low: Safe for outdoors")
Seasonal allergies need education without overload
Drip-feed science via data visualisation
Boring apps fail retention
Gamify logging with animations and visualizations.
Habit formation thrives on simplicity
Streamline symptom entry and reminders for daily consistency.
A dead-simple information architecture with a focus on

Clear hierarchy prioritizing pollen at-a-glance
Building the app to be flexible and scalable
Intuitive navigation for tracking, forecasting and reports
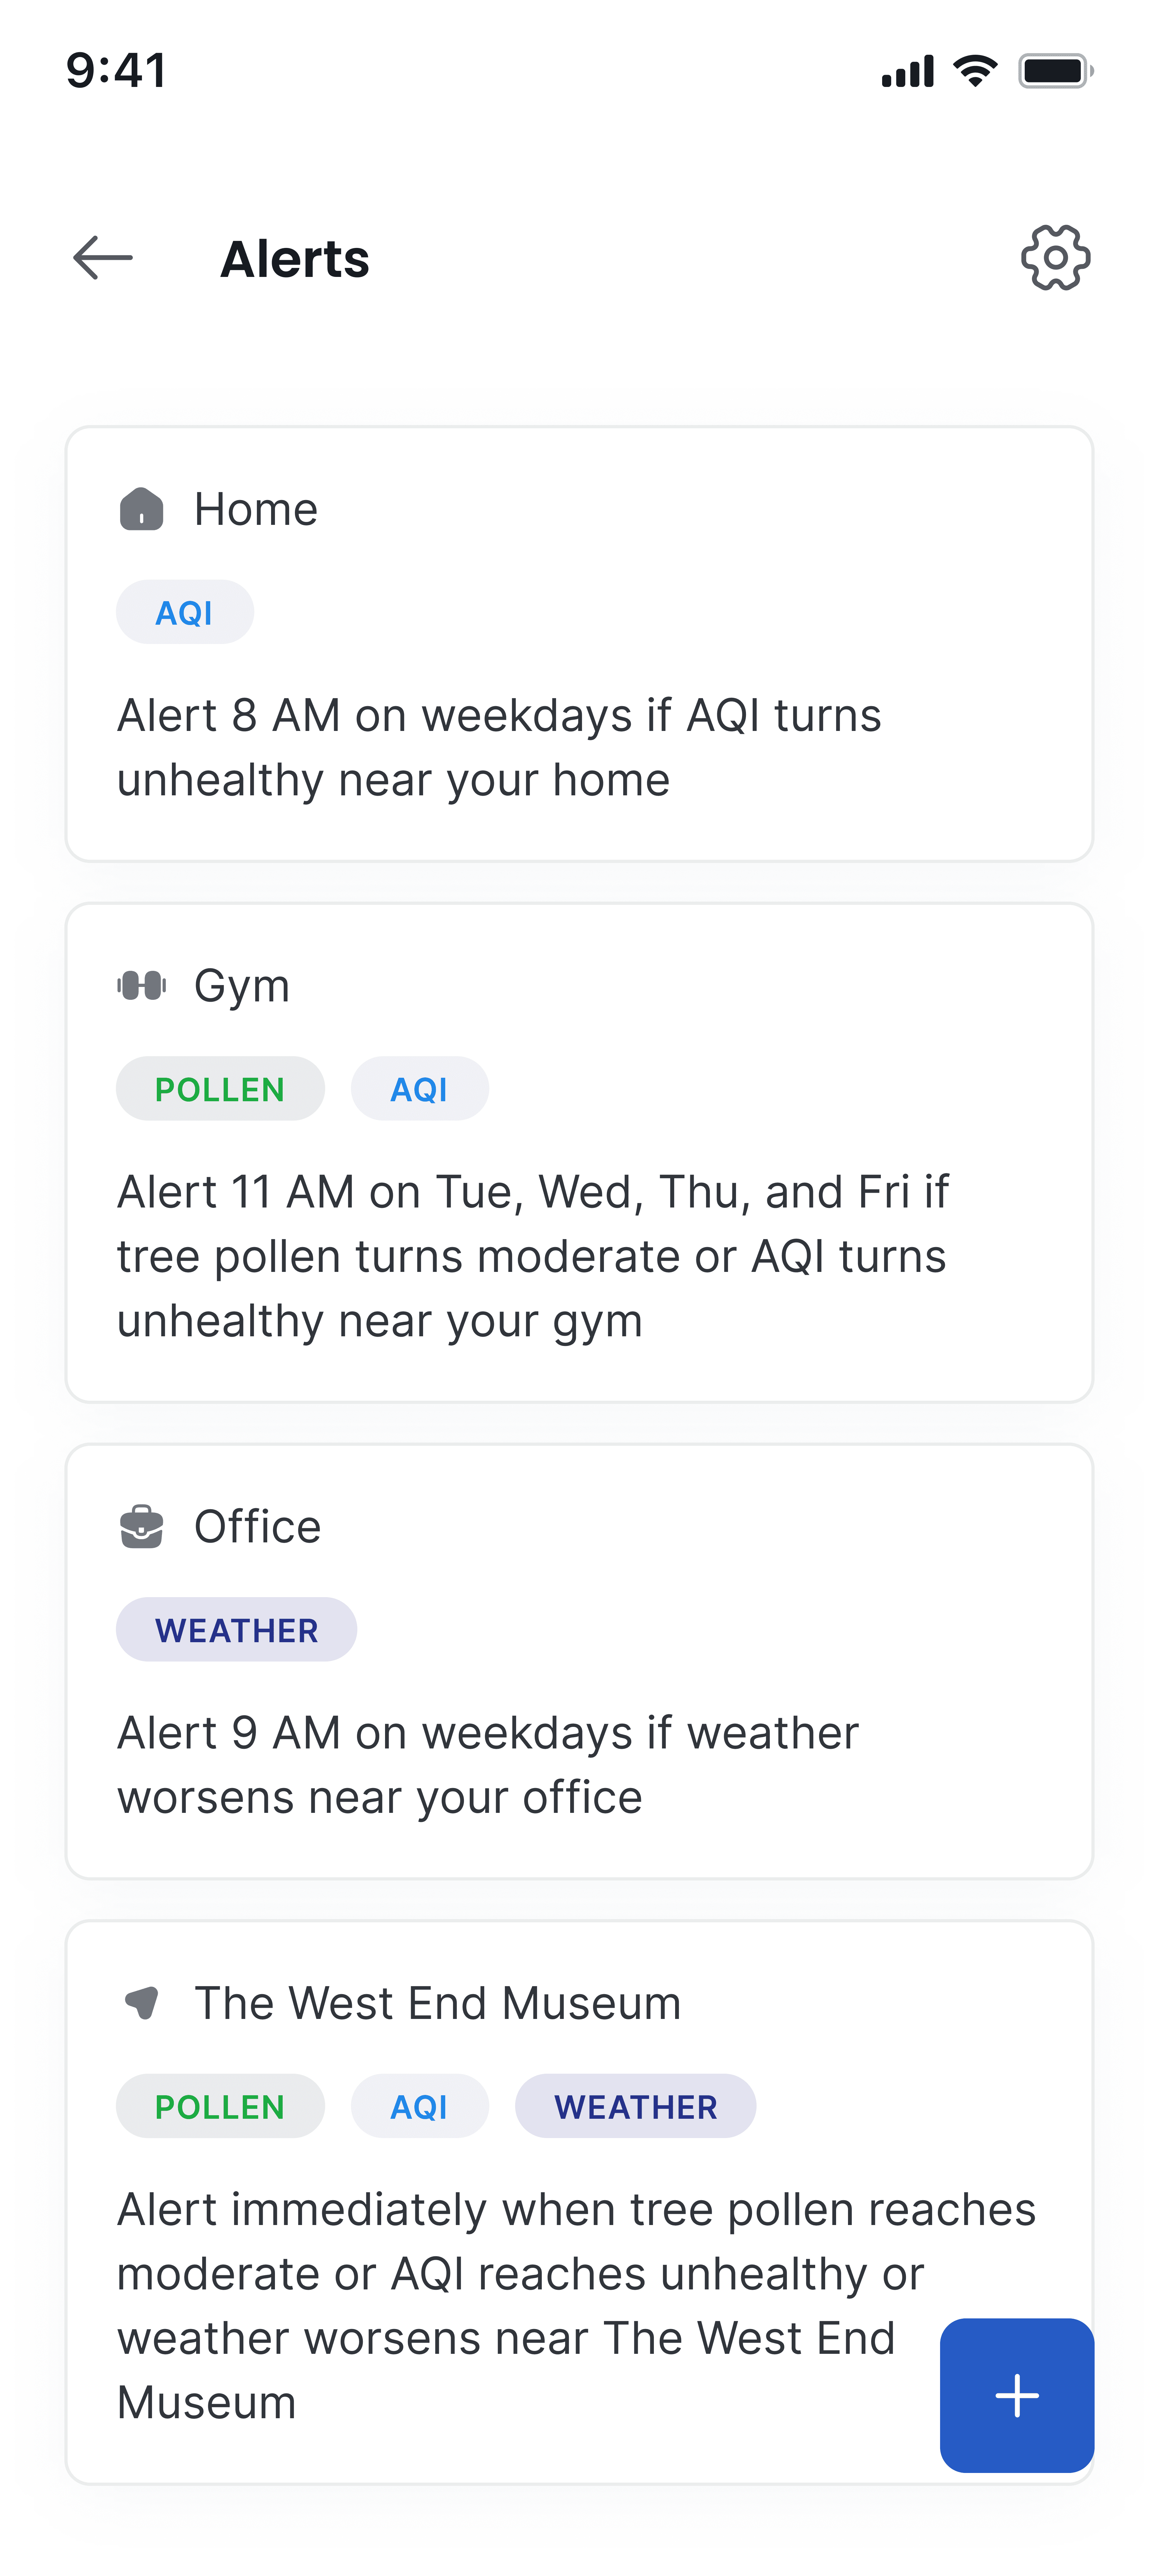
Homepage
Grasp pollen levels and health impacts.
Identify local pollen species.
Plan today and tomorrow.


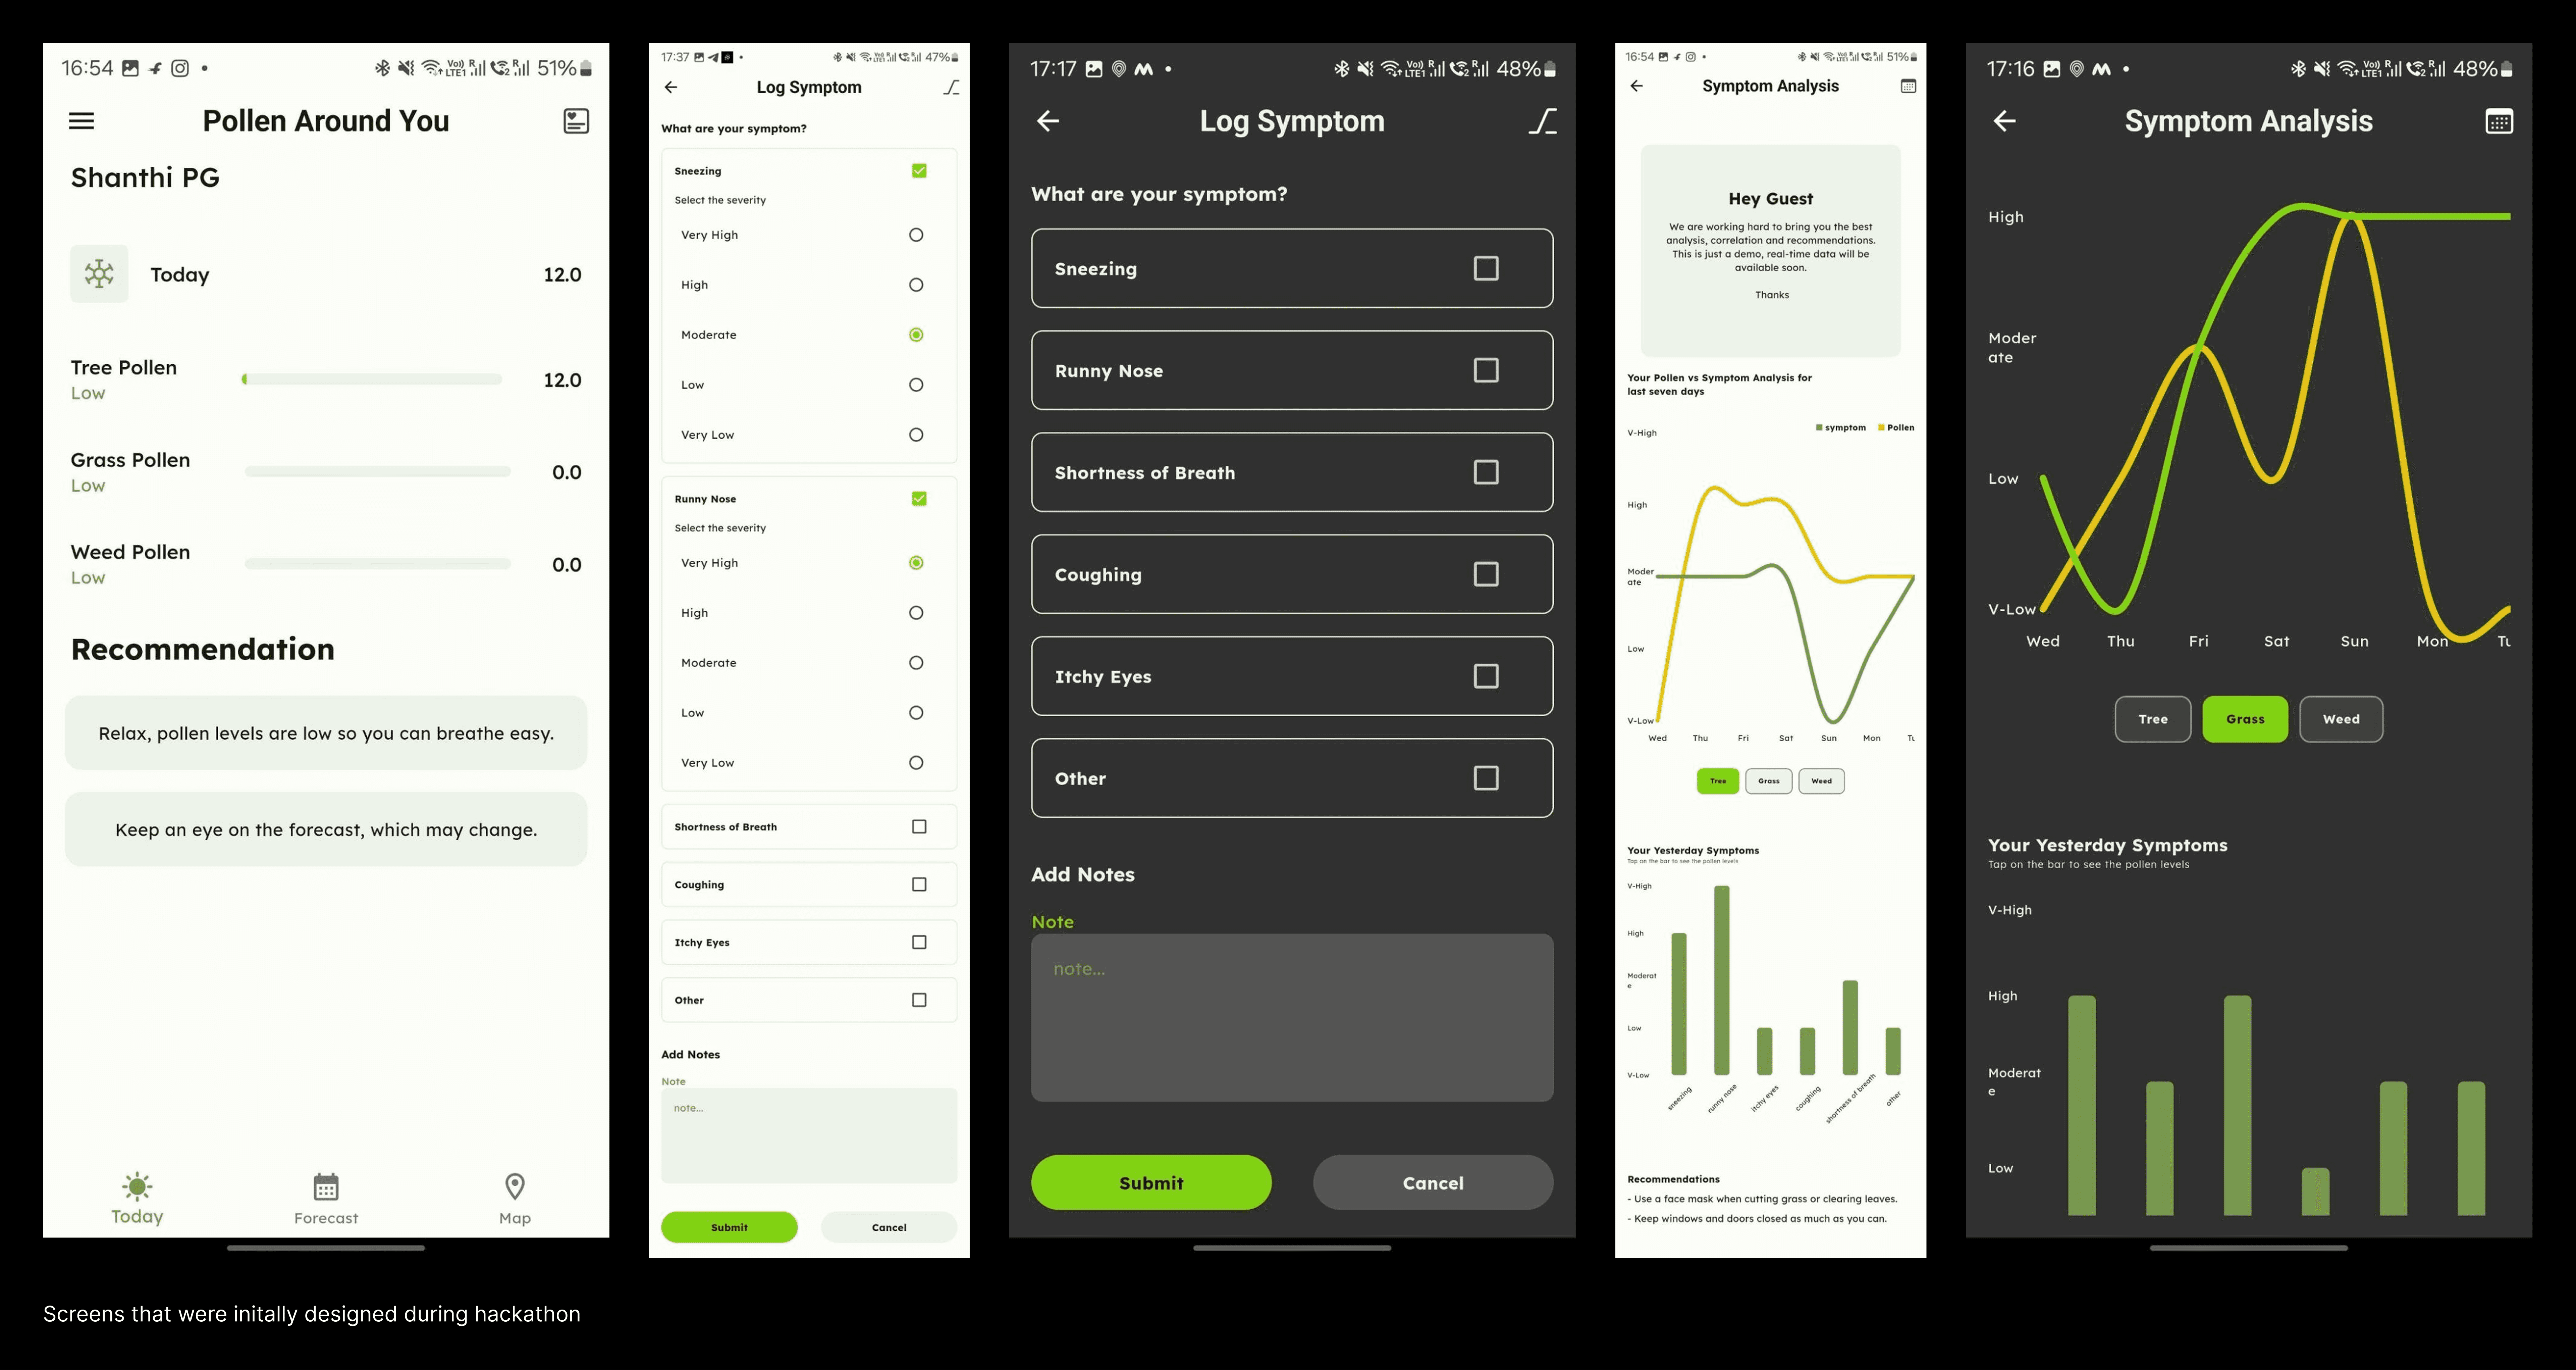
Symptom tracking
Log/track symptoms effortlessly.
Explore pollen-allergy links.
Set medication reminders.


Detailed forecast
Forecast tomorrow's severity and hourly breakdowns.
Get precautions for the week.
Preview pollen at future locations.
Analyze recent symptom spikes.


Science-heavy data becomes approachable through:
Color-coded severity scales (green-low to red-high) with textual summaries.
Animated pollen particles that "bloom"
Interactive maps for cleanest routes
Habit hooks: Streak counters, quick-log badges, and predictive nudges